

New data released by the Office of National Statistics (ONS) on Tuesday, May 5, highlighted that Britain now has the worst coronavirus death toll in Europe. On a positive note locally, the data also show that Rother, and surrounding districts, have experienced a low Covid-19 death rate compared to the national average.
The ONS have calculated that the number of deaths due to Covid-19 per 100,000 people in Rother district stands at just 8. This is slightly higher than the death rate in Hastings, which they have calculated at 6 deaths per 100,000, but lower than neighbouring districts of Wealden, to the west, and Folkestone and Hythe, to the east, as both areas have seen the same death rate from Covid-19 of 16 per 100,000.
The comparable death rate from Covid-19 across England and Wales was 36 deaths per 100,000 and the statistics reported for Rother, and neighbouring districts, are extremely low in comparison to the worst hit areas of the county.
ONS report that the ten worst hit districts in England and Wales are all in London with the London boroughs of Newham, Brent and Hackney suffering the highest rates of Covid-19 related deaths. Newham’s death rate was at 144 per 100,000; Brent’s 141 per 100,000; and Hackney’s 127 per 100,000. London’s overall death rate due to Covid-19 was 85 deaths per 100,000.
The ONS analysis looked at where Covid-19 was the underlying cause or was listed on the death certificate as a contributory factor and covers the six week period of 1 March and 17 April 2020.
No deaths in Rye
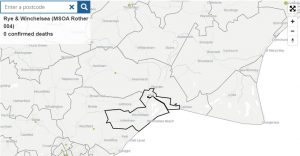
As a further reassurance to the people of Rye of the low Covid-19 death rate in the area, the ONS’s database allows you to search by postcode. Up to 19 April 2020 there have been no confirmed deaths from Covid-19 in the TN31 postcode – which covers Rye and Winchelsea.
Image Credits: ONS https://www.ons.gov.uk/peoplepopulationandcommunity/birthsdeathsandmarriages/deaths/bulletins/deathsinvolvingcovid19bylocalareasanddeprivation/deathsoccurringbetween1marchand17april , ONS http://ons.gov.uk/peoplepopulationandcommunity/healthandsocialcare/causesofdeath/datasets/deathregistrationsandoccurrencesbylocalauthorityandhealthboard .
What about TN 35 and others in your readership area?
Tap on the red highlighted “data” under the map at the top of the page. Scroll down to section 6 on the Office of National Statistics (ONS) Web page and type in your full postcode within figure 5